So this is one for the geeks like me. If you love data, you will enjoy the next 10 minutes of your life.
I raced Ironman Louisville on August 25. It's hard to believe that it was 2 months ago! I talked about my experience during 112 mile bike portion of the race on a previous post, which you can read here. This post is going to be dedicated to breaking down the ride and looking at what I did right and what I would have done different if I had it to do over again.
HEART RATE
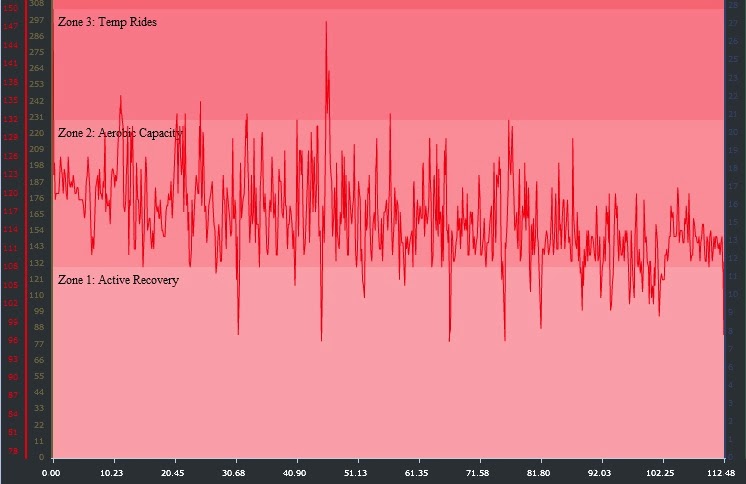
Before I dig into the data collected from my power meter, I want to look at my heart rate. Heart rate monitoring is much cheaper and easier to understand than riding by power. I would venture that say that the majority of triathletes and serious runners have a heart rate monitor and know their zones. There are lots of ways to find your zones and even lots of different zones that you can use. Before purchasing a power meter, I rode based on heart rate. For my 2011 Ironman Louisville race, I rode strictly on heart rate, never letting my HR get above 140 bpm for more than a few seconds. At that time, after several tests, I knew that my aerobic threshold was 140 bpm. During this years race, I didn't even have heart rate displayed on my watch. I was riding on power, so I didn't care what my HR was. I still wore my HR monitor, so the data is there. Here's a look at a graph of my heart rate during the race:
 |
| Click on image to increase size |
So you can see that even though I wasn't riding based on my HR, I still managed to keep it in my aerobic zone. The one major exception is the spike around mile 45. This is a very short, steep hill on Old Sligo Road. For those of you that have ridden the course, you know the hill I'm talking about. Notice that on my second loop, I didn't let this spike occur. You may also notice that throughout the course of the 112 miles, my average HR decreased...which is a good sign of being aerobically efficient.
I like to break this course into 5 segments. The first is miles 0-18. This takes you from T1 all the way up US-42 to the out-and-back. For this segment, my average heart rate was 121 bpm. Segment 2 is the hilly out-and-back to the start of the loops. For this segment, my average HR was 120 bpm. Segments 3 and 4 are the two loops. My average HR for loop 1 was 118 bpm and 114 bpm for loop 2. The final segment is back down US-42 and River Road to transition. For this segment, my average HR was 111 bpm. You can't really compare any two segments other than the loops. So the fact that my average HR stayed about the same (118 vs. 114) for the two loops tells me that I was riding consistent. The four beat per minute drop is likely due to stopping for a few seconds at special needs.
NORMALIZED POWER
I won't spend too much time discussing my Normalized Power. I talked a lot about this in my race report because this was the number that I was watching during the ride. I had a zone I needed to stay in and I was successful.
CADENCE
My power meter also measures cadence. I really don't have a desired cadence that I try to keep while riding, other than trying to maybe increase it during the last 10-15 minutes to get my legs used to turning over quickly. Cadence may be something that I work on increasing this off-season. There are some studies out there that suggest riding at a higher cadence (85-90 rpm) can improve your running economy off the bike. My average cadence for the entire 112 miles was 76, but I don't put too much stock in this because of all the hills and the gear ratio that I was riding. I only came out of the saddle twice all day (that hill on Old Sligo Rd.), so I wasn't mashing the pedals, but I just didn't have enough rear to maintain a high cadence on the climbs.
QUADRANT ANALYSIS
When you combine power and cadence, you get a Quadrant Analysis (QA) chart. It is a way to measure the neuromuscular power demands of cycling. In non-geek terms, this means the actual forces and velocities that the leg muscles must generate to produce a given power output. The QA chart below has average effective pedal force (AEPF) on the Y-axis and circumferential pedal velocity (CPV) on the X-axis. If you want to know more about how these values are measured, you can read about it here or in the book "Training and Racing with a Power Meter" by Andrew Coggan.
The graph is broken up into quadrants. Each quadrant represents a different combination of force (how hard you push the pedals) and pedaling velocity (how fast you push the pedals).
Quadrant I (upper right) is high force and high cadence (sprinting)
Quadrant II (upper left) is high force and low cadence (hill repeats / big gear intervals)
Quadrant III (lower left) is low force and low cadence (aerobic zone ride)
Quadrant IV (lower right) is low force and high cadence (fast pedaling drills or spinning out at the end of a ride)
 |
| Click on image to increase size |
The goal for a long course triathlon would be to spend the majority of your time in Quadrants III and IV. Anytime you are in the "high force" quadrants, you are going to pay for it on the run. As you can see in my chart below, I was in Quadrant III 66% of the time and Quadrant IV 25% of the time. With less than 8% of my time in Quadrants I & II, I would call this a successful Ironman ride!
VARIABILITY INDEX
The next key to a successful Ironman ride is keeping your Variability Index (VI) low. Your VI is simply normalized power divided by average power. The ratio should always be below 1.05 for long-course racing. In order to keep this index number low, it's important to avoid surges. This is commonly done when hammering up a hill, passing someone or when fighting a head wind. These surges, even though sometimes very short, sap your energy very quickly. Keeping your power steady, regardless of terrain or what other riders are doing is a sure way to have energy left for the run. So if I look at my VI for Ironman, it was 1.05 for the whole 112 mile course. If I break the ride down into the segments I described earlier - I was at 1.05 for the 1st segment, 1.06 on the out-and-back (which I've very proud of), 1.05 for loop 1, 1.05 for loop 2, and 1.02 over the final 20 miles. I'm happy with the 1.06 on the out-and-back because it is so hilly. With several long climbs, it would have been easy to spike my average power. Even though 1.06 is slightly higher than I would like, it's good for this segment.

EFFICIENCY FACTOR
Efficiency Factor (EF) is determined by dividing normalized power by average heart rate for the workout. By comparing my EF from the first loop and the second loop, I can tell if my aerobic efficiency was the same. For loop 1, my EF was 1.52. For loop 2, it was 1.53. Another thing that I can look at is my how consistent my EF was for the whole ride. If you can keep the efficiency factor from varying more than 5%, then it's a sign of good aerobic endurance. For Ironman, mine only varied -1.00%

TRAINING STRESS SCORE
The last thing that I want to look at is my Training Stress Score (TSS). This is a composite number that takes into account the duration and intensity of a workout to arrive at a single estimate of the overall training load and physiological stress created by that particular session. For comparison, one hour at functional threshold (as hard as you can go) would equal a score of 100. For Ironman, my TSS was 267.8 - which is a little low considering that a "well-executed" bike leg should result in a score between 275 and 310. But a TSS of 275 would have required me to ride at 68% of my FTP instead of the 66.1% that I rode. It's tough to say whether this slight increase in power would have been detrimental to my run. This higher power output would have probably cut about 8-10 minutes off of my bike split, but what price would I have paid on the run?

So there are other things that I could have evaluated, but that's it for now. I realize that has you read this, it might seem like I am "tooting my own horn" a lot. The fact is, I didn't know what this data was going to look like until I stated pulling it up for this post. This even further solidifies the fact that my minimalist approach to training can and does work for endurance events. This data also tells me that riding Ironman based on power can do nothing but give you an advantage on the run. I had a respectable bike split (top 39% in my Age Group and top 33% Overall) and came off the 112 mile ride feeling fresh and ready to run a marathon. As you will see in my next post when I evaluate the run split, most people did not feel the same way!
Be sure and visit all of my
sponsor's websites. I sought out these companies because they provide
great products and services.
No comments:
Post a Comment